Access the serial console
The serial console which is shown in the WebUI does not show the whole boot process and also not several very critical errors, because in such moments the TCP connection is also interrupted. There are several ways to look at the serial console. First of all, the ESP32 has to be connected via a USB cable to the computer.
Windows
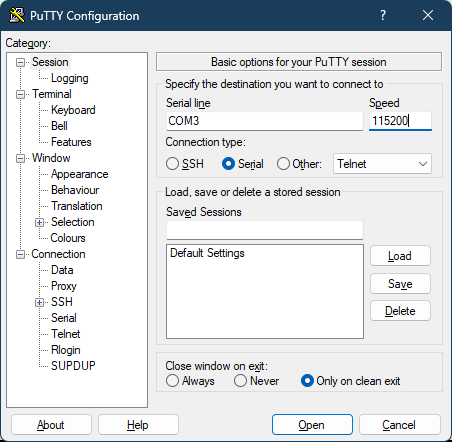
If you are using Windows you can use, e.g., Putty
- Download the putty.exe file and run it.
-
Select "Connection type" --> "Serial", enter the correct serial port (e.g., COM3) and the 115200 as the baud rate.
-
In the section "Session" --> "Logging" you can optionally configure logging output to a file.
- Then click "Open".
Linux
You will see a device pop up when connecting your ESP32. It may be
/dev/ttyUSB0 (or USB1, USB2, etc.) or /dev/ttyACM0 (or ACM1 or ACM2
etc.). If you don't see any device pop up, you can use sudo dmesg in a
terminal to determine the name. Connect to it using a serial terminal.
minicom is recommended for this (sudo apt install minicom):
You should see the output you also see in the Web console. You can also look at
/tmp/capture.txt in parallel to make sure the messages are captured there.
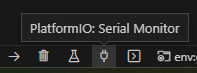
Compiled with VSCode
If you are compiling the source by yourself using VS Code you can just press the "Serial Monitor" button in the status bar.